Governments all over the world resort to spin to present themselves in the best possible light.
The boundary between gloss and outright lies can often be blurred. Statistical information is the easiest to fudge. The actual numbers may not be fabricated; that would be too obvious. Instead the spin masters use a few standard tricks: they select which numbers to present and which to hide, and they drawing unwarranted conclusions from a headline number. Official statistics present every opportunity to cross the line from disingenuous spin to downright misleading propaganda – or lies, in plain English.
Statistics is like a bikini, as the wit said, what it reveals is interesting; what it conceals can be vital.
Here’s an example of misuse of official statistics from India. The Finance Minister tweeted a headline number about annual revenues from direct taxes. For the first time in 2017-18 it had crossed the 1 trillion rupee mark.

But he did more than just mention that 10.02 lakh-crore number. He made 2 further statements – one was implied and the other is an explicit and clear conclusion. Both bear further examination.
The statement that the 2017-18 revenue was 18% higher than in the previous year was not there just for completeness. The implication is that it was a substantial rise; it was a creditable, praiseworthy performance of the Indian economy. Is that really true?
An 18% rise, on the face of it does sound a whopping rise! And it would be creditable if it had bucked the trend. Is that the case?
We do have the figures going back to 2001. They are here, on page 2 of this report from the Govt of India.
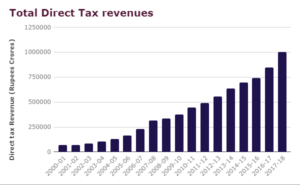
The data cover the years 2001-01 to 2016-17. Lets take the 10.02 trillion Rupees number given by the FM in his tweet for 2017-18 and add it to the existing time series data. The following chart shows the growth in direct tax revenues over the years.

Now, set in the context of previous years’ data the 10.02 trillion figure for 2017-18 looks like it is no more than the trend growth.
What about the 18% y-on-y growth? That sounded impressive. Again, taking the entire data series and plotting the y-on-y % aage increase over the previous year, we get this interesting plot.

So, now the 18% looks par for the course; its good but can it factually be described as ‘historical’? The y-on-y growth has returned to levels last seen in 2010-11, and is nowhere near the amazing near 40% growth seen in 2006-7, and the 36% seen the following year.
Now lets turn to the second part of the statement. The FM drew a clear conclusion about what led to the (not so) creditable 18% growth in 2017-18. He ascribed it unequivocally to ‘accountable governance’ under his leader, the Prime Minister. Leaving aside for the moment the question of the extent to which the Govt allows itself to be held to account, if the 2017-18 performance is ascribed to the leadership of the Prime Minister, the question that begs to be asked is this:
What led to the 9% growth in 2014-15, the 6.6% rise in 2015-16, and the somewhat better 14.5% in 2016-17? You can’t claim credit for a good (if not stellar) performance and deny responsibility for a dismal performance.
References:
- Income Tax Department, Time Series Data, Financial Year 2000-01 to 2016-17. See https://www.incometaxindia.gov.in/Documents/Direct%20Tax%20Data/Time-Series-Data-2016-17.pdf

Now-a-days the system is also not as good as we wish, we need not to blame on some body. Of course, sensational news attracts the people and thus bring them more instant mileage, but need to follow some ethics.
http://www.mebhineta.com/political-consulting-services