Update: The “final turnout” data has also been deleted by the ECI and replaced with provisional data. The investigative posts will be updated accordingly soon.
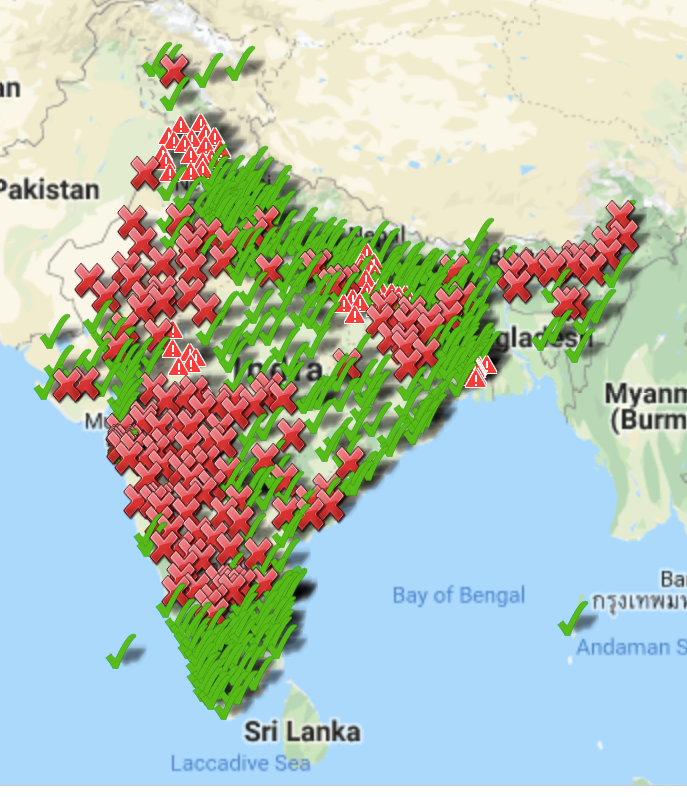
The map below displays the comparison between votes polled and votes counted data for each Constituency in which elections were held during the 2019 Lok Sabha Elections.
To understand the sources used, see here. Please read the following section carefully to understand how to interpret the map.
Please note: constituency-level voter turnout data is only available for the first 6 phases. For the seventh phase, there is only state level data on turnout. Quick summary on state level voter turnout matching votes counted is “zero matches”. Yes, that is correct. The Phase of election in which India’s Prime Minister as well as several other cabinet ministers were elected to Parliament does not have ANY constituency-level turnout data available. Not before counting, not before government formation, not even after government formation.
The data on the first four Phases was uploaded to the Election Commission (EC) website but subsequently deleted when the EC was questioned about discrepancies between votes polled and votes counted. This data is the basis of an interactive visualization here. Quick summary of that too is “zero matches“.
The data for the first four phases is also included in the constituency information pop-up in the map below, but whether the marker is a red cross or a green tick is determined by whether the EVM votes counted match voter turnout reported in EC’s official app (exception below). None of the deleted turnout data matches votes counted anyway – though some of them validate official state-level turnouts.
Where official state CEO data is available, it determines whether there is a tick or cross
Several state CEOs have put out voter turnout data. Not all the data is usable. We were not able to find some. Other data (Uttar Pradesh, West Bengal) is reported only as percentages and this is not usable for verification.
Where votes counted match with official CEO data, there is a green tick. Where official CEO turnout data is available and votes counted don’t match, even if there is a match with the app, it is displayed as a cross.
Final voter turnout reported by CEO Maharashtra. voter turnout data from CEO of Jharkhand, voter turnout from CEO Assam and final voter turnout by Rajasthan CEO are currently included. More will be added over the coming days.
Problems with the official voter app (Voter Turnout) data
There are reports that the data is being altered (screenshots of old app data are convincting that this is indeed happening), including data that is published as final, leading to suspicions that discrepancies are being concealed by simply reporting the EVM votes counted as the turnout. It is impossible to determine whether this is true or false with the information currently available.
Another problem with using the Voter Turnout app data is that while there are a lot of green ticks below indicating that the turnout number matches the votes counted, the turnouts reported on the app themselves don’t add up to the officially declared state-level turnout for the phases. With the information in hand, it is impossible to say whether all data for all constituencies reported in the app is incorrect or only one. We can only see that the totals that should be identical to the official “final turnout” are not so.
The green ticks therefore only indicate that there is a possibility that the data is accurate (if the mismatch in total is caused by another constituency and not the one with the tick), while the red crosses indicate that the EVM votes counted do not currently match ANY voter turnout data provided.

